UML - Overview
UML is a standard language for specifying, visualizing, constructing, and documenting the
artifacts of software systems.
UML was created by the Object Management Group (OMG) and UML 1.0 specification draft was proposed to the OMG in January 1997.
OMG is continuously making efforts to create a truly industry standard.
- UML stands for Unified Modeling Language.
- UML is different from the other common programming languages such as C++, Java, COBOL, etc.
- UML is a pictorial language used to make software blueprints.
- UML can be described as a general purpose visual modeling
language to visualize, specify, construct, and document software system.
- Although UML is generally used to model software systems, it is
not limited within this boundary. It is also used to model non-software
systems as well. For example, the process flow in a manufacturing unit,
etc.
UML is not a programming language but tools can be used to generate
code in various languages using UML diagrams. UML has a direct relation
with object oriented analysis and design. After some standardization,
UML has become an OMG standard.
Goals of UML
A picture is worth a thousand words, this idiom absolutely
fits describing UML. Object-oriented
concepts were introduced much earlier than UML. At that point of time,
there were no standard methodologies to organize and consolidate the
object-oriented development. It was then that UML came into picture.
There are a number of goals for developing UML but the most important
is to define some general purpose modeling language, which all modelers
can use and it also needs to be made simple to understand and use.
UML diagrams are not only made for developers but also for business
users, common people, and anybody interested to understand the system.
The system can be a software or non-software system. Thus it must be
clear that UML is not a development method rather it accompanies with
processes to make it a successful system.
In conclusion, the goal of UML can be defined as a simple modeling
mechanism to model all possible practical systems in today’s complex
environment.
A Conceptual Model of UML
To understand the conceptual model of UML, first we need to clarify
what is a conceptual model? and why a conceptual model is required?
- A conceptual model can be defined as a model which is made of concepts and their relationships.
- A conceptual model is the first step before drawing a UML
diagram. It helps to understand the entities in the real world and how
they interact with each other.
As UML describes the real-time systems, it is very important to make a
conceptual model and then proceed gradually. The conceptual model of
UML can be mastered by learning the following three major elements −
- UML building blocks
- Rules to connect the building blocks
- Common mechanisms of UML
Object-Oriented Concepts
UML can be described as the successor of object-oriented (OO) analysis and design.
An object contains both data and methods that control the data. The
data represents the state of the object. A class describes an object and
they also form a hierarchy to model the real-world system. The
hierarchy is represented as inheritance and the classes can also be
associated in different ways as per the requirement.
Objects are the real-world entities that exist around us and the
basic concepts such as abstraction, encapsulation, inheritance, and
polymorphism all can be represented using UML.
UML is powerful enough to represent all the concepts that exist in
object-oriented analysis and design. UML diagrams are representation of
object-oriented concepts only. Thus, before learning UML, it becomes
important to understand OO concept in detail.
Following are some fundamental concepts of the object-oriented world −
- Objects − Objects represent an entity and the basic building block.
- Class − Class is the blue print of an object.
- Abstraction − Abstraction represents the behavior of an real world entity.
- Encapsulation − Encapsulation is the mechanism of binding the data together and
hiding them from the outside world.
- Inheritance − Inheritance is the mechanism of making new classes from existing ones.
- Polymorphism − It defines the mechanism to exists in different forms.
OO Analysis and Design
OO can be defined as an investigation and to be more specific, it is
the investigation of objects. Design means collaboration of identified
objects.
Thus, it is important to understand the OO analysis and design
concepts. The most important purpose of OO analysis is to identify
objects of a system to be designed. This analysis is also done for an
existing system. Now an efficient analysis is only possible when we are
able to start thinking in a way where objects can be identified. After
identifying the objects, their relationships are identified and finally
the design is produced.
The purpose of OO analysis and design can described as −
- Identifying the objects of a system.
- Identifying their relationships.
- Making a design, which can be converted to executables using OO languages.
There are three basic steps where the OO concepts are applied and implemented. The steps can be defined as
OO Analysis → OO Design → OO implementation using OO languages
The above three points can be described in detail as −
- During OO analysis, the most important purpose is to identify
objects and describe them in a proper way. If these objects are
identified efficiently, then the next job of design is easy. The objects
should be identified with responsibilities. Responsibilities are the
functions performed by the object. Each and every object has some type
of responsibilities to be performed. When these responsibilities are
collaborated, the purpose of the system is fulfilled.
- The second phase is OO design. During this phase, emphasis is
placed on the requirements and their fulfilment. In this stage, the
objects are collaborated according to their intended association. After
the association is complete, the
design is also complete.
- The third phase is OO implementation. In this phase, the design is implemented using OO languages such as Java, C++, etc.
Role of UML in OO Design
UML is a modeling language used to model software and non-software
systems. Although UML is used for non-software systems, the emphasis is
on modeling OO software applications. Most of the UML diagrams discussed
so far are used to model different
aspects such as static, dynamic, etc. Now whatever be the aspect, the
artifacts are nothing but objects.
If we look into class diagram, object diagram, collaboration diagram,
interaction diagrams all would basically be designed based on the
objects.
Hence, the relation between OO design and UML is very important to
understand. The OO design is transformed into UML diagrams according to
the requirement. Before understanding the UML in detail, the OO concept
should be learned properly. Once the OO analysis and design is done, the
next step is very easy. The input from OO analysis and
design is the input to UML diagrams.
UML - Building Blocks
As UML describes the real-time systems, it is very important to make a
conceptual model and then proceed gradually. The conceptual model of
UML can be mastered by learning the following three major elements −
- UML building blocks
- Rules to connect the building blocks
- Common mechanisms of UML
This chapter describes all the UML building blocks. The building blocks of UML can be defined as −
- Things
- Relationships
- Diagrams
Things
Things are the most important building blocks of UML. Things can be −
- Structural
- Behavioral
- Grouping
- Annotational
Structural Things
Structural things define the static part of the model. They represent the physical and
conceptual elements. Following are the brief descriptions of the structural things.
Class − Class represents a set of objects having similar responsibilities.
 Interface −
 Interface defines a set of operations, which specify the responsibility of a class.
 Collaboration −
Collaboration defines an interaction between elements.
 Use case −
Use case represents a set of actions performed by a system for a specific goal.
 Component −
Component describes the physical part of a system.
 Node −
 A node can be defined as a physical element that exists at run time.

Behavioral Things
A behavioral thing consists of the dynamic parts of UML models. Following are the
behavioral things −
Interaction − Interaction is defined as a behavior that
consists of a group of messages exchanged among elements to accomplish a
specific task.
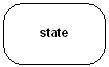
 State machine −
 State machine is useful when the state of an
object in its life cycle is
important. It defines the sequence of states an object goes through in
response to events. Events are external factors responsible for state
change
Grouping Things
Grouping things can be defined as a mechanism to group elements of a UML model together. There is only one grouping thing available −
Package − Package is the only one grouping thing available for gathering structural and behavioral things.
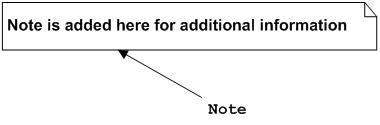
Annotational Things
Annotational things can be defined as a mechanism to capture remarks, descriptions, and comments of UML model elements.
Note - It is the only one Annotational thing available. A note is used to render comments, constraints, etc. of an UML element.

Relationship
Relationship is another most important building block of UML. It shows how the elements
are associated with each other and this association describes the functionality of an application.
There are four kinds of relationships available.
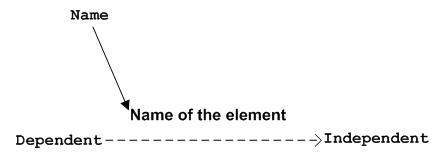
Dependency
Dependency is a relationship between two things in which change in one element also affects the other.
Association
Association is basically a set of links that connects the elements of
a UML model. It also describes how many objects are taking part in that
relationship.
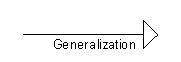
Generalization
Generalization can be defined as a relationship which connects a
specialized element with a generalized element. It basically describes
the inheritance relationship in the world of objects.
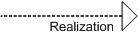
Realization
Realization can be defined as a relationship in which two elements
are connected. One element describes some responsibility, which is not
implemented and the other one implements them. This relationship exists
in case of interfaces.
UML Diagrams
UML diagrams are the ultimate output of the entire discussion. All
the elements, relationships are used to make a complete UML diagram and
the diagram represents a system.
The visual effect of the UML diagram is the most important part of
the entire process. All the other elements are used to make it complete.
UML includes the following nine diagrams, the details of which are described in the subsequent chapters.
- Class diagram
- Object diagram
- Use case diagram
- Sequence diagram
- Collaboration diagram
- Activity diagram
- Statechart diagram
- Deployment diagram
- Component diagram
UML - Architecture
Any real-world system is used by different users. The users can be
developers, testers, business people, analysts, and many more. Hence,
before designing a system, the architecture is made with different
perspectives in mind. The most important part is to
visualize the system from the perspective of different viewers. The
better we understand the better we can build the system.
UML plays an important role in defining different perspectives of a system. These perspectives are −
- Design
- Implementation
- Process
- Deployment
The center is the
Use Case view which connects all these four. A
Use Case represents
the functionality of the system. Hence, other perspectives are connected with use case.
Design of a system consists of classes, interfaces, and collaboration. UML provides class
diagram, object diagram to support this.
Implementation defines the components assembled together to
make a complete physical system. UML component diagram is used to
support the implementation perspective.
Process defines the flow of the system. Hence, the same elements as used in Design are
also used to support this perspective.
Deployment represents the physical nodes of the system that forms the hardware. UML
deployment diagram is used to support this perspective.
UML - Modeling Types
It is very important to distinguish between the UML model. Different
diagrams are used for different types of UML modeling. There are three
important types of UML modeling.
Structural Modeling
Structural modeling captures the static features of a system. They consist of the following −
- Classes diagrams
- Objects diagrams
- Deployment diagrams
- Package diagrams
- Composite structure diagram
- Component diagram
Structural model represents the framework for the system and this
framework is the place where all other components exist. Hence, the
class diagram, component diagram and deployment diagrams are part of
structural modeling. They all represent the elements and the mechanism
to assemble them.
The structural model never describes the dynamic behavior of the
system. Class diagram is the most widely used structural diagram.
Behavioral Modeling
Behavioral model describes the interaction in the system. It
represents the interaction among the structural diagrams. Behavioral
modeling shows the dynamic nature of the system. They consist of the
following −
- Activity diagrams
- Interaction diagrams
- Use case diagrams
All the above show the dynamic sequence of flow in a system.
Architectural Modeling
Architectural model represents the overall framework of the system.
It contains both structural and behavioral elements of the system.
Architectural model can be defined as the blueprint of the entire
system. Package diagram comes under architectural modeling.
UML - Basic Notations
UML is popular for its diagrammatic notations. We all know that UML
is for visualizing, specifying, constructing and documenting the
components of software and non-software systems. Hence, visualization is
the most important part which needs to be understood and remembered.
UML notations are the most important elements in modeling. Efficient
and appropriate use of notations is very important for making a complete
and meaningful model. The model is useless, unless its purpose is
depicted properly.
Hence, learning notations should be emphasized from the very
beginning. Different notations are available for things and
relationships. UML diagrams are made using the notations of things and
relationships. Extensibility is another important feature which
makes UML more powerful and flexible.
The chapter describes basic UML notations in detail. This is just an
extension to the UML building block section discussed in Chapter Two.
Structural Things
Graphical notations used in structural things are most widely used in
UML. These are considered as the nouns of UML models. Following are the
list of structural things.
- Classes
- Object
- Interface
- Collaboration
- Use case
- Active classes
- Components
- Nodes
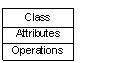
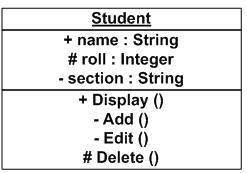
Class Notation
UML
class is represented by the following figure. The diagram is divided into four parts.
- The top section is used to name the class.
- The second one is used to show the attributes of the class.
- The third section is used to describe the operations performed by the class.
- The fourth section is optional to show any additional components.
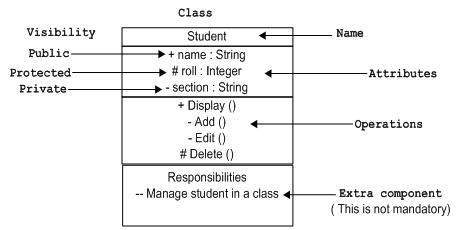
Classes are used to represent objects. Objects can be anything having properties and responsibility.
Object Notation
The
object is represented in the same way as the class. The only difference is the
name which is underlined as shown in the following figure.
As the object is an actual implementation of a class, which is known
as the instance of a class. Hence, it has the same usage as the class.
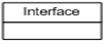
Interface Notation
Interface is represented by a circle as shown in the following
figure. It has a name which is generally written below the circle.
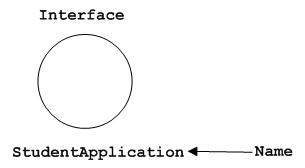
Interface is used to describe the functionality without
implementation. Interface is just like
a template where you define different functions, not the implementation.
When a class implements the interface, it also implements the
functionality as per requirement.
Collaboration Notation
Collaboration is represented by a dotted eclipse as shown in the following figure. It has a name written inside the eclipse.
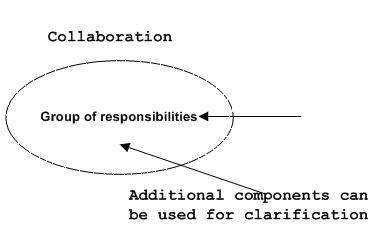
Collaboration represents responsibilities. Generally, responsibilities are in a group.
Use Case Notation
Use case is represented as an eclipse with a name inside it. It may contain additional responsibilities.
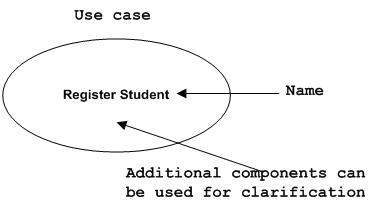
Use case is used to capture high level functionalities of a system.
Actor Notation
An actor can be defined as some internal or external entity that interacts with the system.
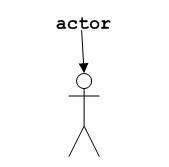
An actor is used in a use case diagram to describe the internal or external entities.
Initial State Notation
Initial state is defined to show the start of a process. This notation is used in almost all diagrams.
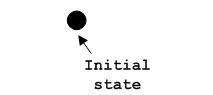
The usage of Initial State Notation is to show the starting point of a process.
Final State Notation
Final state is used to show the end of a process. This notation is also used in almost all diagrams to describe the end.
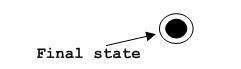
The usage of Final State Notation is to show the termination point of a process.
Active Class Notation
Active class looks similar to a class with a solid border. Active
class is generally used to describe the concurrent behavior of a system.
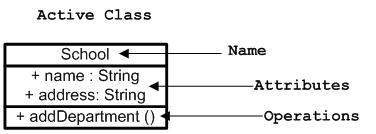
Active class is used to represent the concurrency in a system.
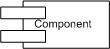
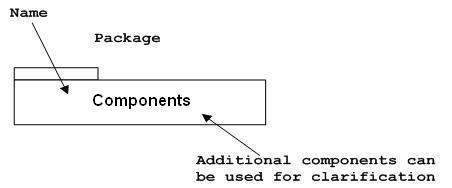
Component Notation
A component in UML is shown in the following figure with a name inside. Additional elements can be added wherever required.
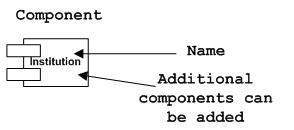
Component is used to represent any part of a system for which UML diagrams are made.
Node Notation
A node in UML is represented by a square box as shown in the
following figure with a name. A node represents the physical component
of the system.
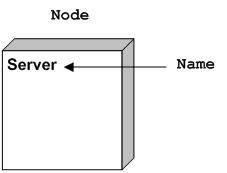
Node is used to represent the physical part of a system such as the server, network, etc.
Behavioral Things
Dynamic parts are one of the most important elements in UML. UML has a set of powerful
features to represent the dynamic part of software and non-software systems. These features include
interactions and
state machines.
Interactions can be of two types −
- Sequential (Represented by sequence diagram)
- Collaborative (Represented by collaboration diagram)
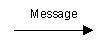
Interaction Notation
Interaction is basically a message exchange between two UML
components. The following diagram represents different notations used in
an interaction.
Interaction is used to represent the communication among the components of a system.
State Machine Notation
State machine describes the different states of a component in its
life cycle. The notations are described in the following diagram.
State machine is used to describe different states of a system
component. The state can be active, idle, or any other depending upon
the situation.
Grouping Things
Organizing the UML models is one of the most important aspects of the
design. In UML, there is only one element available for grouping and
that is package.
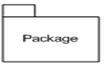
Package Notation
Package notation is shown in the following figure and is used to wrap the components of a system.
Annotational Things
In any diagram, explanation of different elements and their functionalities are very important. Hence, UML has
notes notation to support this requirement.
Note Notation
This notation is shown in the following figure. These notations are used to provide necessary information of a system.
Relationships
A model is not complete unless the relationships between elements are described properly.
The
Relationship gives a proper meaning to a UML model. Following are the different types
of relationships available in UML.
- Dependency
- Association
- Generalization
- Extensibility
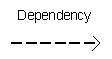
Dependency Notation
Dependency is an important aspect in UML elements. It describes the dependent elements and the direction of dependency.
Dependency is represented by a dotted arrow as shown in the following
figure. The arrow head represents the independent element and the other
end represents the dependent element.
Dependency is used to represent the dependency between two elements of a system
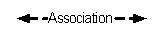
Association Notation
Association describes how the elements in a UML diagram are
associated. In simple words, it describes how many elements are taking
part in an interaction.
Association is represented by a dotted line with (without) arrows on
both sides. The two ends represent two associated elements as shown in
the following figure. The multiplicity is also mentioned at the ends (1,
*, etc.) to show how many objects are associated.
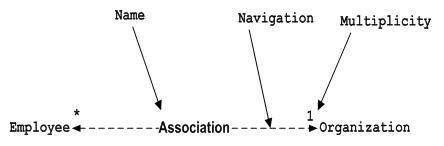
Association is used to represent the relationship between two elements of a system.
Generalization Notation
Generalization describes the inheritance relationship of the object-oriented world. It is a
parent and child relationship.
Generalization is represented by an arrow with a hollow arrow head as
shown in the following figure. One end represents the parent element
and the other end represents the child element.
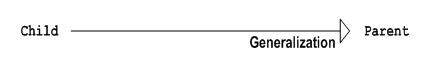
Generalization is used to describe parent-child relationship of two elements of a system.
Extensibility Notation
All the languages (programming or modeling) have some mechanism to
extend its capabilities such as syntax, semantics, etc. UML also has the
following mechanisms to provide extensibility features.
- Stereotypes (Represents new elements)
- Tagged values (Represents new attributes)
- Constraints (Represents the boundaries)
Extensibility notations are used to enhance the power of the
language. It is basically additional elements used to represent some
extra behavior of the system. These extra behaviors are not covered by
the standard available notations.
UML - Standard Diagrams
In the previous chapters, we have discussed about the building blocks
and other necessary elements of UML. Now we need to understand where to
use those elements.
The elements are like components which can be associated in different
ways to make a complete UML picture, which is known as diagram. Thus,
it is very important to understand the different diagrams to implement
the knowledge in real-life systems.
Any complex system is best understood by making some kind of diagrams
or pictures. These diagrams have a better impact on our understanding.
If we look around, we will realize that the diagrams are not a new
concept but it is used widely in different forms in different
industries.
We prepare UML diagrams to understand the system in a better and
simple way. A single diagram is not enough to cover all the aspects of
the system. UML defines various kinds of diagrams to cover most of the
aspects of a system.
You can also create your own set of diagrams to meet your
requirements. Diagrams are generally made in an incremental and
iterative way.
There are two broad categories of diagrams and they are again divided into subcategories −
- Structural Diagrams
- Behavioral Diagrams
Structural Diagrams
The structural diagrams represent the static aspect of the system.
These static aspects represent those parts of a diagram, which forms the
main structure and are therefore stable.
These static parts are represented by classes, interfaces, objects, components, and nodes. The four structural diagrams are −
- Class diagram
- Object diagram
- Component diagram
- Deployment diagram
Class Diagram
Class diagrams are the most common diagrams used in UML. Class
diagram consists of classes, interfaces, associations, and
collaboration. Class diagrams basically represent the object-oriented
view of a system, which is static in nature.
Active class is used in a class diagram to represent the concurrency of the system.
Class diagram represents the object orientation of a system. Hence,
it is generally used for development purpose. This is the most widely
used diagram at the time of system construction.
Object Diagram
Object diagrams can be described as an instance of class diagram.
Thus, these diagrams are more close to real-life scenarios where we
implement a system.
Object diagrams are a set of objects and their relationship is just like class diagrams. They
also represent the static view of the system.
The usage of object diagrams is similar to class diagrams but they
are used to build prototype of a system from a practical perspective.
Component Diagram
Component diagrams represent a set of components and their
relationships. These components consist of classes, interfaces, or
collaborations. Component diagrams represent the implementation view of a
system.
During the design phase, software artifacts (classes, interfaces,
etc.) of a system are arranged in different groups depending upon their
relationship. Now, these groups are known as components.
Finally, it can be said component diagrams are used to visualize the implementation.
Deployment Diagram
Deployment diagrams are a set of nodes and their relationships. These
nodes are physical entities where the components are deployed.
Deployment diagrams are used for visualizing the deployment view of a system. This is generally used by the deployment team.
Note − If the above descriptions and usages are observed
carefully then it is very clear that
all the diagrams have some relationship with one another. Component
diagrams are dependent upon the classes, interfaces, etc. which are part
of class/object diagram. Again, the deployment diagram is dependent
upon the components, which are used to make
component diagrams.
Behavioral Diagrams
Any system can have two aspects, static and dynamic. So, a model is considered as
complete when both the aspects are fully covered.
Behavioral diagrams basically capture the dynamic aspect of a system.
Dynamic aspect can be further described as the changing/moving parts of
a system.
UML has the following five types of behavioral diagrams −
- Use case diagram
- Sequence diagram
- Collaboration diagram
- Statechart diagram
- Activity diagram
Use Case Diagram
Use case diagrams are a set of use cases, actors, and their relationships. They represent the use case view of a system.
A use case represents a particular functionality of a system. Hence,
use case diagram is used to describe the relationships among the
functionalities and their internal/external controllers. These
controllers are known as
actors.
Sequence Diagram
A sequence diagram is an interaction diagram. From the name, it is
clear that the diagram deals with some sequences, which are the sequence
of messages flowing from one object to another.
Interaction among the components of a system is very important from
implementation and execution perspective. Sequence diagram is used to
visualize the sequence of calls in a system to perform a specific
functionality.
Collaboration Diagram
Collaboration diagram is another form of interaction diagram. It represents the structural
organization of a system and the messages sent/received. Structural organization consists of objects and links.
The purpose of collaboration diagram is similar to sequence diagram.
However, the specific purpose of collaboration diagram is to visualize
the organization of objects and their interaction.
Statechart Diagram
Any real-time system is expected to be reacted by some kind of
internal/external events. These events are responsible for state change
of the system.
Statechart diagram is used to represent the event driven state change
of a system. It basically describes the state change of a class,
interface, etc.
State chart diagram is used to visualize the reaction of a system by internal/external factors.
Activity Diagram
Activity diagram describes the flow of control in a system. It
consists of activities and links. The flow can be sequential,
concurrent, or branched.
Activities are nothing but the functions of a system. Numbers of
activity diagrams are prepared to capture the entire flow in a system.
Activity diagrams are used to visualize the flow of controls in a
system. This is prepared to have an idea of how the system will work
when executed.
Note − Dynamic nature of a system is very difficult to
capture. UML has provided features
to capture the dynamics of a system from different angles. Sequence
diagrams and collaboration diagrams are isomorphic, hence they can be
converted from one another without losing any information. This is also
true for Statechart and activity diagram.
UML - Class Diagram
Class diagram is a static diagram. It represents the static view of
an application. Class diagram is not only used for visualizing,
describing, and documenting different aspects of a system but also for
constructing executable code of the software application.
Class diagram describes the attributes and operations of a class and
also the constraints
imposed on the system. The class diagrams are widely used in the
modeling of objectoriented systems because they are the only UML
diagrams, which can be mapped directly with object-oriented languages.
Class diagram shows a collection of classes, interfaces, associations, collaborations, and
constraints. It is also known as a structural diagram.
Purpose of Class Diagrams
The purpose of class diagram is to model the static view of an
application. Class diagrams are the only diagrams which can be directly
mapped with object-oriented languages and thus widely used at the time
of construction.
UML diagrams like activity diagram, sequence diagram can only give
the sequence flow of the application, however class diagram is a bit
different. It is the most popular UML diagram in the coder community.
The purpose of the class diagram can be summarized as −
- Analysis and design of the static view of an application.
- Describe responsibilities of a system.
- Base for component and deployment diagrams.
- Forward and reverse engineering.
How to Draw a Class Diagram?
Class diagrams are the most popular UML diagrams used for construction of software
applications. It is very important to learn the drawing procedure of class diagram.
Class diagrams have a lot of properties to consider while drawing but here the diagram will be considered from a top level view.
Class diagram is basically a graphical representation of the static
view of the system and represents different aspects of the application. A
collection of class diagrams represent the whole system.
The following points should be remembered while drawing a class diagram −
- The name of the class diagram should be meaningful to describe the aspect of the system.
- Each element and their relationships should be identified in advance.
- Responsibility (attributes and methods) of each class should be clearly identified
- For each class, minimum number of properties should be specified, as unnecessary properties will make the diagram complicated.
- Use notes whenever required to describe some aspect of the
diagram. At the end of the drawing it should be understandable to the
developer/coder.
- Finally, before making the final version, the diagram should be
drawn on plain paper and reworked as many times as possible to make it
correct.
The following diagram is an example of an Order System of an
application. It describes a particular aspect of the entire application.
- First of all, Order and Customer are identified as the two
elements of the system. They have a one-to-many relationship because a
customer can have multiple orders.
- Order class is an abstract class and it has two concrete classes (inheritance relationship) SpecialOrder and NormalOrder.
- The two inherited classes have all the properties as the Order class. In addition,
they have additional functions like dispatch () and receive ().
The following class diagram has been drawn considering all the points mentioned above.
Where to Use Class Diagrams?
Class diagram is a static diagram and it is used to model the static
view of a system. The static view describes the vocabulary of the
system.
Class diagram is also considered as the foundation for component and
deployment diagrams. Class diagrams are not only used to visualize the
static view of the system but they are also used to construct the
executable code for forward and reverse engineering
of any system.
Generally, UML diagrams are not directly mapped with any
object-oriented programming languages but the class diagram is an
exception.
Class diagram clearly shows the mapping with object-oriented
languages such as Java, C++, etc. From practical experience, class
diagram is generally used for construction purpose.
In a nutshell it can be said, class diagrams are used for −
- Describing the static view of the system.
- Showing the collaboration among the elements of the static view.
- Describing the functionalities performed by the system.
- Construction of software applications using object oriented languages.
UML - Object Diagrams
Object diagrams are derived from class diagrams so object diagrams are dependent upon class diagrams.
Object diagrams represent an instance of a class diagram. The basic
concepts are similar for class diagrams and object diagrams. Object
diagrams also represent the static view of a system but this static view
is a snapshot of the system at a particular moment.
Object diagrams are used to render a set of objects and their relationships as an instance.
Purpose of Object Diagrams
The purpose of a diagram should be understood clearly to implement it
practically. The purposes of object diagrams are similar to class
diagrams.
The difference is that a class diagram represents an abstract model
consisting of classes and their relationships. However, an object
diagram represents an instance at a particular moment, which is concrete
in nature.
It means the object diagram is closer to the actual system behavior.
The purpose is to capture the static view of a system at a particular
moment.
The purpose of the object diagram can be summarized as −
- Forward and reverse engineering.
- Object relationships of a system
- Static view of an interaction.
- Understand object behaviour and their relationship from practical perspective
How to Draw an Object Diagram?
We have already discussed that an object diagram is an instance of a
class diagram. It implies that an object diagram consists of instances
of things used in a class diagram.
So both diagrams are made of same basic elements but in different
form. In class diagram elements are in abstract form to represent the
blue print and in object diagram the elements are in concrete form to
represent the real world object.
To capture a particular system, numbers of class diagrams are
limited. However, if we consider object diagrams then we can have
unlimited number of instances, which are unique in nature. Only those
instances are considered, which have an impact on the
system.
From the above discussion, it is clear that a single object diagram cannot capture all the
necessary instances or rather cannot specify all the objects of a system. Hence, the solution is −
- First, analyze the system and decide which instances have important data and association.
- Second, consider only those instances, which will cover the functionality.
- Third, make some optimization as the number of instances are unlimited.
Before drawing an object diagram, the following things should be remembered and understood clearly −
- Object diagrams consist of objects.
- The link in object diagram is used to connect objects.
- Objects and links are the two elements used to construct an object diagram.
After this, the following things are to be decided before starting the construction of the diagram −
- The object diagram should have a meaningful name to indicate its purpose.
- The most important elements are to be identified.
- The association among objects should be clarified.
- Values of different elements need to be captured to include in the object diagram.
- Add proper notes at points where more clarity is required.
The following diagram is an example of an object diagram. It
represents the Order management system which we have discussed in the
chapter Class Diagram. The following diagram is an instance of the
system at a particular time of purchase. It has the following
objects.
- Customer
- Order
- SpecialOrder
- NormalOrder
Now the customer object (C) is associated with three order objects
(O1, O2, and O3). These order objects are associated with special order
and normal order objects (S1, S2, and N1). The customer has the
following three orders with different numbers (12, 32 and 40) for the
particular time considered.
The customer can increase the number of orders in future and in that
scenario the object diagram will reflect that. If order, special order,
and normal order objects are observed then you will find that they have
some values.
For orders, the values are 12, 32, and 40 which implies that the
objects have these values for a particular moment (here the particular
time when the purchase is made is considered as the moment) when the
instance is captured
The same is true for special order and normal order objects which
have number of orders as 20, 30, and 60. If a different time of purchase
is considered, then these values will change accordingly.
The following object diagram has been drawn considering all the points mentioned above
Where to Use Object Diagrams?
Object diagrams can be imagined as the snapshot of a running system
at a particular moment. Let us consider an example of a running train
Now, if you take a snap of the running train then you will find a static picture of it having the following −
- A particular state which is running.
- A particular number of passengers. which will change if the snap is taken in a different time
Here, we can imagine the snap of the running train is an object
having the above values. And this is true for any real-life simple or
complex system.
In a nutshell, it can be said that object diagrams are used for −
- Making the prototype of a system.
- Reverse engineering.
- Modeling complex data structures.
- Understanding the system from practical perspective.
UML - Component Diagrams
Component diagrams are different in terms of nature and behavior.
Component diagrams are used to model the physical aspects of a system.
Now the question is, what are these physical aspects? Physical aspects
are the elements such as executables, libraries, files,
documents, etc. which reside in a node.
Component diagrams are used to visualize the organization and
relationships among components in a system. These diagrams are also used
to make executable systems.
Purpose of Component Diagrams
Component diagram is a special kind of diagram in UML. The purpose is
also different from all other diagrams discussed so far. It does not
describe the functionality of the system but it describes the components
used to make those functionalities.
Thus from that point of view, component diagrams are used to
visualize the physical components in a system. These components are
libraries, packages, files, etc.
Component diagrams can also be described as a static implementation
view of a system. Static implementation represents the organization of
the components at a particular moment.
A single component diagram cannot represent the entire system but a collection of
diagrams is used to represent the whole.
The purpose of the component diagram can be summarized as −
- Visualize the components of a system.
- Construct executables by using forward and reverse engineering.
- Describe the organization and relationships of the components.
How to Draw a Component Diagram?
Component diagrams are used to describe the physical artifacts of a system. This artifact
includes files, executables, libraries, etc
The purpose of this diagram is different. Component diagrams are used
during the implementation phase of an application. However, it is
prepared well in advance to visualize the implementation details.
Initially, the system is designed using different UML diagrams and
then when the artifacts are ready, component diagrams are used to get an
idea of the implementation.
This diagram is very important as without it the application cannot
be implemented efficiently. A well-prepared component diagram is also
important for other aspects such as application performance,
maintenance, etc.
Before drawing a component diagram, the following artifacts are to be identified clearly −
- Files used in the system.
- Libraries and other artifacts relevant to the application.
- Relationships among the artifacts.
After identifying the artifacts, the following points need to be kept in mind.
- Use a meaningful name to identify the component for which the diagram is to be drawn.
- Prepare a mental layout before producing the using tools.
- Use notes for clarifying important points.
Following is a component diagram for order management system. Here,
the artifacts are files. The diagram shows the files in the application
and their relationships. In actual, the component diagram also contains
dlls, libraries, folders, etc.
In the following diagram, four files are identified and their
relationships are produced. Component diagram cannot be matched directly
with other UML diagrams discussed so far as it is drawn for completely
different purpose.
The following component diagram has been drawn considering all the points mentioned above.
Where to Use Component Diagrams?
We have already described that component diagrams are used to
visualize the static implementation view of a system. Component diagrams
are special type of UML diagrams used for different purposes.
These diagrams show the physical components of a system. To clarify
it, we can say that component diagrams describe the organization of the
components in a system.
Organization can be further described as the location of the
components in a system. These components are organized in a special way
to meet the system requirements.
As we have already discussed, those components are libraries, files,
executables, etc. Before implementing the application, these components
are to be organized. This component organization is also designed
separately as a part of project execution.
Component diagrams are very important from implementation
perspective. Thus, the implementation team of an application should have
a proper knowledge of the component details
Component diagrams can be used to −
- Model the components of a system.
- Model the database schema.
- Model the executables of an application.
- Model the system's source code.
UML - Deployment Diagrams
Deployment diagrams are used to visualize the topology of the
physical components of a system, where the software components are
deployed.
Deployment diagrams are used to describe the static deployment view
of a system. Deployment diagrams consist of nodes and their
relationships.
Purpose of Deployment Diagrams
The term Deployment itself describes the purpose of the diagram.
Deployment diagrams are used for describing the hardware components,
where software components are deployed. Component diagrams and
deployment diagrams are closely related.
Component diagrams are used to describe the components and deployment diagrams shows how they are deployed in hardware.
UML is mainly designed to focus on the software artifacts of a
system. However, these two diagrams are special diagrams used to focus
on software and hardware components.
Most of the UML diagrams are used to handle logical components but
deployment diagrams are made to focus on the hardware topology of a
system. Deployment diagrams are used by the system engineers.
The purpose of deployment diagrams can be described as −
- Visualize the hardware topology of a system.
- Describe the hardware components used to deploy software components.
- Describe the runtime processing nodes.
How to Draw a Deployment Diagram?
Deployment diagram represents the deployment view of a system. It is
related to the component diagram because the components are deployed
using the deployment diagrams. A deployment diagram consists of nodes.
Nodes are nothing but physical
hardware used to deploy the application.
Deployment diagrams are useful for system engineers. An efficient
deployment diagram is very important as it controls the following
parameters −
- Performance
- Scalability
- Maintainability
- Portability
Before drawing a deployment diagram, the following artifacts should be identified −
- Nodes
- Relationships among nodes
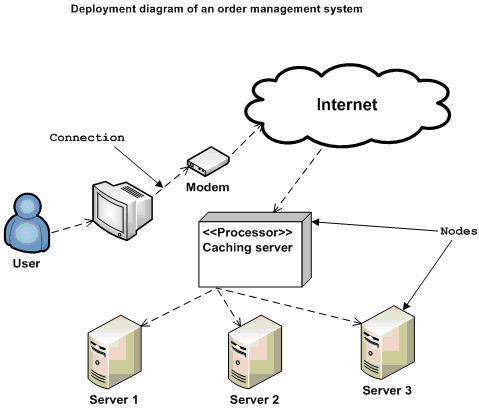
Following is a sample deployment diagram to provide an idea of the
deployment view of order management system. Here, we have shown nodes as
−
- Monitor
- Modem
- Caching server
- Server
The application is assumed to be a web-based application, which is
deployed in a clustered
environment using server 1, server 2, and server 3. The user connects to
the application using the Internet. The control flows from the caching
server to the clustered environment.
The following deployment diagram has been drawn considering all the points mentioned above.
Where to Use Deployment Diagrams?
Deployment diagrams are mainly used by system engineers. These
diagrams are used to describe the physical components (hardware), their
distribution, and association.
Deployment diagrams can be visualized as the hardware components/nodes on which the software components reside.
Software applications are developed to model complex business
processes. Efficient software applications are not sufficient to meet
the business requirements. Business requirements can be described as the
need to support the increasing number of users,
quick response time, etc.
To meet these types of requirements, hardware components should be designed efficiently and in a cost-effective way.
Now-a-days software applications are very complex in nature. Software
applications can be standalone, web-based, distributed, mainframe-based
and many more. Hence, it is very important to design the hardware
components efficiently.
Deployment diagrams can be used −
- To model the hardware topology of a system.
- To model the embedded system.
- To model the hardware details for a client/server system.
- To model the hardware details of a distributed application.
- For Forward and Reverse engineering.
UML - Use Case Diagrams
To model a system, the most important aspect is to capture the
dynamic behavior. Dynamic behavior means the behavior of the system when
it is running/operating.
Only static behavior is not sufficient to model a system rather
dynamic behavior is more important than static behavior. In UML, there
are five diagrams available to model the dynamic nature and use case
diagram is one of them. Now as we have to discuss that the use case
diagram is dynamic in nature, there should be some internal or external
factors for making the interaction.
These internal and external agents are known as actors. Use case
diagrams consists of actors, use cases and their relationships. The
diagram is used to model the system/subsystem of an application. A
single use case diagram captures a particular functionality of a system.
Hence to model the entire system, a number of use case diagrams are used.
Purpose of Use Case Diagrams
The purpose of use case diagram is to capture the dynamic aspect of a
system. However, this definition is too generic to describe the
purpose, as other four diagrams (activity, sequence, collaboration, and
Statechart) also have the same purpose. We will look into some specific
purpose, which will distinguish it from other four diagrams.
Use case diagrams are used to gather the requirements of a system
including internal and
external influences. These requirements are mostly design requirements.
Hence, when a system is analyzed to gather its functionalities, use
cases are prepared and actors are identified.
When the initial task is complete, use case diagrams are modelled to present the outside view.
In brief, the purposes of use case diagrams can be said to be as follows −
- Used to gather the requirements of a system.
- Used to get an outside view of a system.
- Identify the external and internal factors influencing the system.
- Show the interaction among the requirements are actors.
How to Draw a Use Case Diagram?
Use case diagrams are considered for high level requirement analysis
of a system. When the requirements of a system are analyzed, the
functionalities are captured in use cases.
We can say that use cases are nothing but the system functionalities
written in an organized manner. The second thing which is relevant to
use cases are the actors. Actors can be defined as something that
interacts with the system.
Actors can be a human user, some internal applications, or may be
some external applications. When we are planning to draw a use case
diagram, we should have the following items identified.
- Functionalities to be represented as use case
- Actors
- Relationships among the use cases and actors.
Use case diagrams are drawn to capture the functional requirements of a system. After
identifying the above items, we have to use the following guidelines to draw an efficient use case diagram
- The name of a use case is very important. The name should be
chosen in such a way so that it can identify the functionalities
performed.
- Give a suitable name for actors.
- Show relationships and dependencies clearly in the diagram.
- Do not try to include all types of relationships, as the main purpose of the diagram
is to identify the requirements.
- Use notes whenever required to clarify some important points.
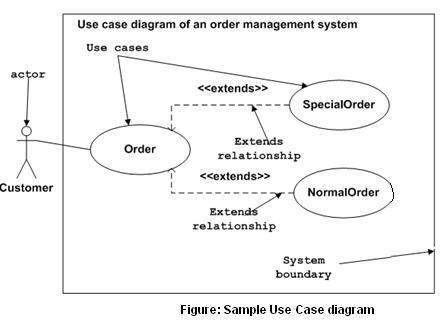
Following is a sample use case diagram representing the order
management system. Hence, if we look into the diagram then we will find
three use cases
(Order,
SpecialOrder, and NormalOrder) and one actor which is the customer.
The SpecialOrder and NormalOrder use cases are extended from
Order
use case. Hence, they have extended relationship. Another important
point is to identify the system boundary, which is shown in the picture.
The actor Customer lies outside the system as it is an external user of
the system.
Where to Use a Use Case Diagram?
As we have already discussed there are five diagrams in UML to model
the dynamic view of a system. Now each and every model has some specific
purpose to use. Actually these specific purposes are different angles
of a running system.
To understand the dynamics of a system, we need to use different
types of diagrams. Use case diagram is one of them and its specific
purpose is to gather system requirements and actors.
Use case diagrams specify the events of a system and their flows. But
use case diagram never describes how they are implemented. Use case
diagram can be imagined as a black box where only the input, output, and
the function of the black box is known.
These diagrams are used at a very high level of design. This high
level design is refined again and again to get a complete and practical
picture of the system. A well-structured use case also describes the
pre-condition, post condition, and exceptions. These extra elements are
used to make test cases when performing the testing.
Although use case is not a good candidate for forward and reverse
engineering, still they are used in a slightly different way to make
forward and reverse engineering. The same is true for reverse
engineering. Use case diagram is used differently to make it suitable
for reverse engineering.
In forward engineering, use case diagrams are used to make test cases
and in reverse engineering use cases are used to prepare the
requirement details from the existing application.
Use case diagrams can be used for −
- Requirement analysis and high level design.
- Model the context of a system.
- Reverse engineering.
- Forward engineering.
UML - Interaction Diagrams
From the term Interaction, it is clear that the diagram is used to
describe some type of interactions among the different elements in the
model. This interaction is a part of dynamic behavior of the system.
This interactive behavior is represented in UML by two diagrams known as
Sequence diagram and
Collaboration diagram. The basic purpose of both the diagrams are similar.
Sequence diagram emphasizes on time sequence of messages and
collaboration diagram emphasizes on the structural organization of the
objects that send and receive messages.
Purpose of Interaction Diagrams
The purpose of interaction diagrams is to visualize the interactive
behavior of the system. Visualizing the interaction is a difficult task.
Hence, the solution is to use different types of models to capture the
different aspects of the interaction.
Sequence and collaboration diagrams are used to capture the dynamic nature but from a different angle.
The purpose of interaction diagram is −
- To capture the dynamic behaviour of a system.
- To describe the message flow in the system.
- To describe the structural organization of the objects.
- To describe the interaction among objects.
How to Draw an Interaction Diagram?
As we have already discussed, the purpose of interaction diagrams is
to capture the dynamic aspect of a system. So to capture the dynamic
aspect, we need to understand what a dynamic aspect is and how it is
visualized. Dynamic aspect can be defined as the
snapshot of the running system at a particular moment
We have two types of interaction diagrams in UML. One is the sequence diagram and the
other is the collaboration diagram. The sequence diagram captures the time sequence of
the message flow from one object to another and the collaboration diagram describes the
organization of objects in a system taking part in the message flow.
Following things are to be identified clearly before drawing the interaction diagram
- Objects taking part in the interaction.
- Message flows among the objects.
- The sequence in which the messages are flowing.
- Object organization.
Following are two interaction diagrams modeling the order management
system. The first diagram is a sequence diagram and the second is a
collaboration diagram
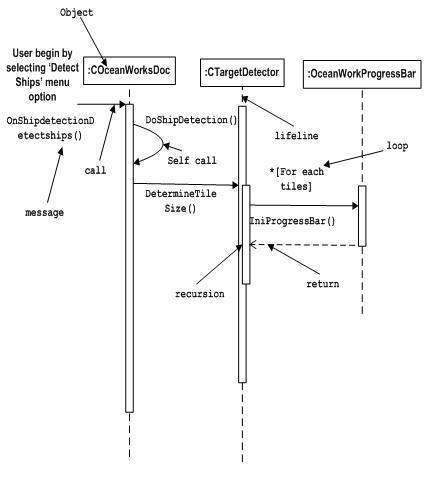
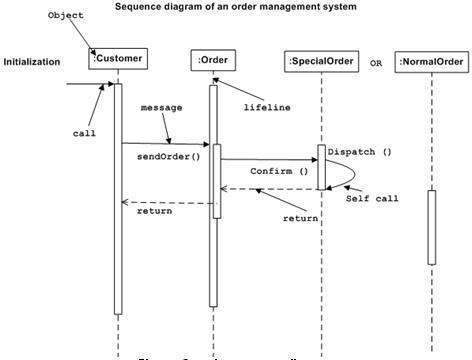
The Sequence Diagram
The sequence diagram has four objects (Customer, Order, SpecialOrder and NormalOrder).
The following diagram shows the message sequence for
SpecialOrder object and the same can be used in case of
NormalOrder
object. It is important to understand the time sequence of message
flows. The message flow is nothing but a method call of an object.
The first call is
sendOrder () which is a method of
Order object. The next call is
confirm () which is a method of
SpecialOrder object and the last call is
Dispatch () which is a method of
SpecialOrder object. The following diagram mainly describes the method calls
from one object to another, and this is also the actual scenario when the system is running.
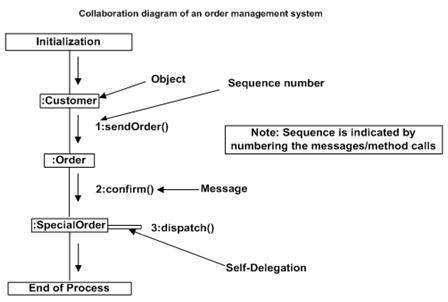
The Collaboration Diagram
The second interaction diagram is the collaboration diagram. It shows
the object organization as seen in the following diagram. In the
collaboration diagram, the method call sequence is indicated by some
numbering technique. The number indicates how the
methods are called one after another. We have taken the same order
management system to describe the collaboration diagram.
Method calls are similar to that of a sequence diagram. However,
difference being the sequence diagram does not describe the object
organization, whereas the collaboration diagram shows the object
organization.
To choose between these two diagrams, emphasis is placed on the type
of requirement. If the time sequence is important, then the sequence
diagram is used. If organization is required, then collaboration diagram
is used.
Where to Use Interaction Diagrams?
We have already discussed that interaction diagrams are used to
describe the dynamic nature of a system. Now, we will look into the
practical scenarios where these diagrams are used. To understand the
practical application, we need to understand the basic nature
of sequence and collaboration diagram.
The main purpose of both the diagrams are similar as they are used to
capture the dynamic behavior of a system. However, the specific purpose
is more important to clarify and understand.
Sequence diagrams are used to capture the order of messages flowing
from one object to another. Collaboration diagrams are used to describe
the structural organization of the objects taking part in the
interaction. A single diagram is not sufficient to describe the dynamic
aspect of an entire system, so a set of diagrams are used to capture it
as a whole.
Interaction diagrams are used when we want to understand the message
flow and the structural organization. Message flow means the sequence
of control flow from one object to another. Structural organization
means the visual organization of the elements in a system.
Interaction diagrams can be used −
- To model the flow of control by time sequence.
- To model the flow of control by structural organizations.
- For forward engineering.
- For reverse engineering.
UML - Statechart Diagrams
The name of the diagram itself clarifies the purpose of the diagram and other details. It
describes different states of a component in a system. The states are specific to a component/object of a system.
A Statechart diagram describes a state machine. State machine can be
defined as a machine which defines different states of an object and
these states are controlled by external or internal events.
Activity diagram explained in the next chapter, is a special kind of a
Statechart diagram. As Statechart diagram defines the states, it is
used to model the lifetime of an object.
Purpose of Statechart Diagrams
Statechart diagram is one of the five UML diagrams used to model the
dynamic nature of a system. They define different states of an object
during its lifetime and these states are changed by events. Statechart
diagrams are useful to model the reactive systems. Reactive systems can
be defined as a system that responds to external or internal events.
Statechart diagram describes the flow of control from one state to
another state. States are defined as a condition in which an object
exists and it changes when some event is triggered. The most important
purpose of Statechart diagram is to model lifetime of an object from
creation to termination.
Statechart diagrams are also used for forward and reverse engineering
of a system. However, the main purpose is to model the reactive system.
Following are the main purposes of using Statechart diagrams −
- To model the dynamic aspect of a system.
- To model the life time of a reactive system.
- To describe different states of an object during its life time.
- Define a state machine to model the states of an object.
How to Draw a Statechart Diagram?
Statechart diagram is used to describe the states of different
objects in its life cycle. Emphasis is placed on the state changes upon
some internal or external events. These states of objects are important
to analyze and implement them accurately.
Statechart diagrams are very important for describing the states.
States can be identified as the condition of objects when a particular
event occurs.
Before drawing a Statechart diagram we should clarify the following points −
- Identify the important objects to be analyzed.
- Identify the states.
- Identify the events.
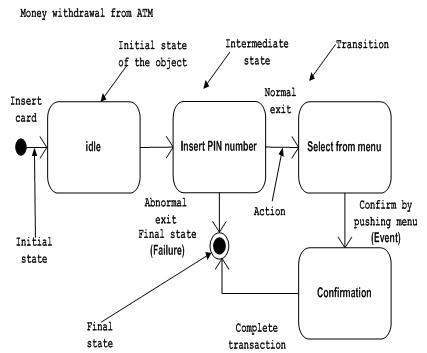
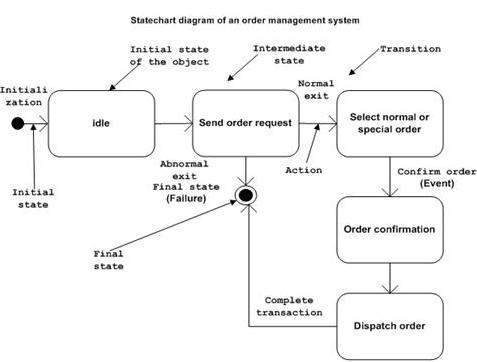
Following is an example of a Statechart diagram where the state of Order object is analyzed
The first state is an idle state from where the process starts. The
next states are arrived for events like send request, confirm request,
and dispatch order. These events are responsible for the state changes
of order object.
During the life cycle of an object (here order object) it goes
through the following states and there may be some abnormal exits. This
abnormal exit may occur due to some problem in the system. When the
entire life cycle is complete, it is considered as a complete
transaction as shown in the following figure. The initial and final
state of an object is also shown in the following figure.
Where to Use Statechart Diagrams?
From the above discussion, we can define the practical applications
of a Statechart diagram. Statechart diagrams are used to model the
dynamic aspect of a system like other four diagrams discussed in this
tutorial. However, it has some distinguishing characteristics for
modeling the dynamic nature.
Statechart diagram defines the states of a component and these state
changes are dynamic in nature. Its specific purpose is to define the
state changes triggered by events. Events are internal or external
factors influencing the system.
Statechart diagrams are used to model the states and also the events
operating on the system. When implementing a system, it is very
important to clarify different states of an object during its life time
and Statechart diagrams are used for this purpose. When these states and
events are identified, they are used to model it and these models are
used during the implementation of the system.
If we look into the practical implementation of Statechart diagram,
then it is mainly used to analyze the object states influenced by
events. This analysis is helpful to understand the system behavior
during its execution.
The main usage can be described as −
- To model the object states of a system.
- To model the reactive system. Reactive system consists of reactive objects.
- To identify the events responsible for state changes.
- Forward and reverse engineering.
UML - Activity Diagrams
Activity diagram is another important diagram in UML to describe the dynamic aspects of the system.
Activity diagram is basically a flowchart to represent the flow from one activity to another
activity. The activity can be described as an operation of the system.
The control flow is drawn from one operation to another. This flow
can be sequential, branched, or concurrent. Activity diagrams deal with
all type of flow control by using different elements such as fork, join,
etc
Purpose of Activity Diagrams
The basic purposes of activity diagrams is similar to other four
diagrams. It captures the dynamic behavior of the system. Other four
diagrams are used to show the message flow from one object to another
but activity diagram is used to show message flow from one activity to
another.
Activity is a particular operation of the system. Activity diagrams
are not only used for visualizing the dynamic nature of a system, but
they are also used to construct the executable system by using forward
and reverse engineering techniques. The only missing
thing in the activity diagram is the message part.
It does not show any message flow from one activity to another.
Activity diagram is sometimes considered as the flowchart. Although the
diagrams look like a flowchart, they are not. It shows different flows
such as parallel, branched, concurrent, and single.
The purpose of an activity diagram can be described as −
- Draw the activity flow of a system.
- Describe the sequence from one activity to another.
- Describe the parallel, branched and concurrent flow of the system.
How to Draw an Activity Diagram?
Activity diagrams are mainly used as a flowchart that consists of
activities performed by the system. Activity diagrams are not exactly
flowcharts as they have some additional capabilities. These additional
capabilities include branching, parallel flow, swimlane, etc.
Before drawing an activity diagram, we must have a clear
understanding about the elements used in activity diagram. The main
element of an activity diagram is the activity itself. An activity is a
function performed by the system. After identifying the activities, we
need to understand how they are associated with constraints and
conditions.
Before drawing an activity diagram, we should identify the following elements −
- Activities
- Association
- Conditions
- Constraints
Once the above-mentioned parameters are identified, we need to make a
mental layout of the entire flow. This mental layout is then
transformed into an activity diagram.
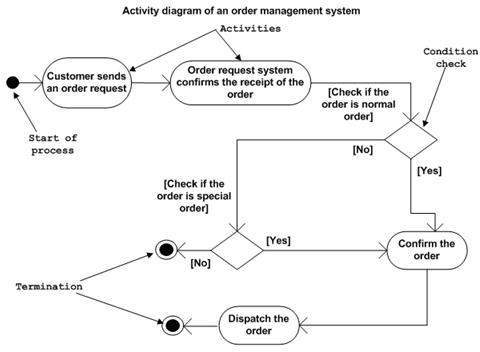
Following is an example of an activity diagram for order management
system. In the diagram, four activities are identified which are
associated with conditions. One important point should be clearly
understood that an activity diagram cannot be exactly matched with the
code. The activity diagram is made to understand the flow of activities
and is mainly used by the business users
Following diagram is drawn with the four main activities −
- Send order by the customer
- Receipt of the order
- Confirm the order
- Dispatch the order
After receiving the order request, condition checks are performed to
check if it is normal or special order. After the type of order is
identified, dispatch activity is performed and that is marked as the
termination of the process.
Where to Use Activity Diagrams?
The basic usage of activity diagram is similar to other four UML
diagrams. The specific usage is to model the control flow from one
activity to another. This control flow does not include messages.
Activity diagram is suitable for modeling the activity flow of the
system. An application can
have multiple systems. Activity diagram also captures these systems and
describes the flow from one system to another. This specific usage is
not available in other diagrams. These systems can be database, external
queues, or any other system.
We will now look into the practical applications of the activity
diagram. From the above discussion, it is clear that an activity diagram
is drawn from a very high level. So it gives high level view of a
system. This high level view is mainly for business users or any other
person who is not a technical person.
This diagram is used to model the activities which are nothing but
business requirements. The diagram has more impact on business
understanding rather than on implementation details.
Activity diagram can be used for −
- Modeling work flow by using activities.
- Modeling business requirements.
- High level understanding of the system's functionalities.
- Investigating business requirements at a later stage.
 Ali Aydar is a computer scientist and Internet entrepreneur.
He is the chief executive officer at Sporcle. He is best known as an
early employee and key technical contributor at the original Napster.
Aydar bought Fanning his first book on programming in C++, the language
he would use two years later to build the Napster file-sharing software.
Ali Aydar is a computer scientist and Internet entrepreneur.
He is the chief executive officer at Sporcle. He is best known as an
early employee and key technical contributor at the original Napster.
Aydar bought Fanning his first book on programming in C++, the language
he would use two years later to build the Napster file-sharing software. Anita Borg (January 17, 1949 – April 6, 2003) was an American
computer scientist. She founded the Institute for Women and Technology
(now the Anita Borg Institute for Women and Technology). While at
Digital Equipment, she developed and patented a method for generating
complete address traces for analyzing and designing high-speed memory
systems.
Anita Borg (January 17, 1949 – April 6, 2003) was an American
computer scientist. She founded the Institute for Women and Technology
(now the Anita Borg Institute for Women and Technology). While at
Digital Equipment, she developed and patented a method for generating
complete address traces for analyzing and designing high-speed memory
systems. Alfred Aho (born August 9, 1941) is a Canadian computer
scientist best known for his work on programming languages, compilers,
and related algorithms, and his textbooks on the art and science of
computer programming. Aho received a B.A.Sc. in Engineering Physics from
the University of Toronto.
Alfred Aho (born August 9, 1941) is a Canadian computer
scientist best known for his work on programming languages, compilers,
and related algorithms, and his textbooks on the art and science of
computer programming. Aho received a B.A.Sc. in Engineering Physics from
the University of Toronto. Bjarne Stroustrup (born 30 December 1950) is a Danish computer
scientist, most notable for the creation and development of the widely
used C++ programming language. He is a Distinguished Research Professor
and holds the College of Engineering Chair in Computer Science.
Bjarne Stroustrup (born 30 December 1950) is a Danish computer
scientist, most notable for the creation and development of the widely
used C++ programming language. He is a Distinguished Research Professor
and holds the College of Engineering Chair in Computer Science. Bill Gates (born October 28, 1955) is an American business
magnate, philanthropist, investor, computer programmer, and inventor.
Gates is the former chief executive and chairman of Microsoft, the
world’s largest personal-computer software company, which he co-founded
with Paul Allen.
Bill Gates (born October 28, 1955) is an American business
magnate, philanthropist, investor, computer programmer, and inventor.
Gates is the former chief executive and chairman of Microsoft, the
world’s largest personal-computer software company, which he co-founded
with Paul Allen. Bruce Arden (born in 1927 in Minneapolis, Minnesota) is an
American computer scientist. He graduated from Purdue University with a
BS(EE) in 1949 and started his computing career in 1950 with the wiring
and programming of IBM's hybrid (mechanical and electronic) Card
Programmed Computer/Calculator at the Allison Division of General
Motors.
Bruce Arden (born in 1927 in Minneapolis, Minnesota) is an
American computer scientist. He graduated from Purdue University with a
BS(EE) in 1949 and started his computing career in 1950 with the wiring
and programming of IBM's hybrid (mechanical and electronic) Card
Programmed Computer/Calculator at the Allison Division of General
Motors. Brendan Eich (born 1960 or 1961)is an American technologist
and creator of the JavaScript scripting language. He cofounded the
Mozilla project, the Mozilla Foundation and the Mozilla Corporation, and
served as the Mozilla Corporation's chief technical officer and briefly
its chief executive officer.
Brendan Eich (born 1960 or 1961)is an American technologist
and creator of the JavaScript scripting language. He cofounded the
Mozilla project, the Mozilla Foundation and the Mozilla Corporation, and
served as the Mozilla Corporation's chief technical officer and briefly
its chief executive officer. Barry Boehm (born 1935) is an American software engineer,
Distinguished Professor of Computer Science, Industrial and Systems
Engineering, the TRW Professor of Software Engineering. He is known for
his many contributions to the area of software engineering.
Barry Boehm (born 1935) is an American software engineer,
Distinguished Professor of Computer Science, Industrial and Systems
Engineering, the TRW Professor of Software Engineering. He is known for
his many contributions to the area of software engineering. Bert Bos (born 10 November 1963, The Hague, Netherlands) is a
computer scientist. He studied mathematics at the University of
Groningen, and wrote his PhD thesis on Rapid user interface development
with the script language Gist. In 1996, he joined the World Wide Web
Consortium (W3C) to work on Cascading Style Sheets (CSS).
Bert Bos (born 10 November 1963, The Hague, Netherlands) is a
computer scientist. He studied mathematics at the University of
Groningen, and wrote his PhD thesis on Rapid user interface development
with the script language Gist. In 1996, he joined the World Wide Web
Consortium (W3C) to work on Cascading Style Sheets (CSS).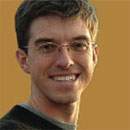 Bryan Cantrill (born 1973) is an American Software Engineer
who worked at Sun Microsystems and later at Oracle Corporation following
its acquisition of Sun. Cantrill was included in the TR35 list for his
development of DTrace, a function of the OS Solaris 10 that provides a
non-invasive means for real-time tracing and diagnosis of software. He
is currently Chief Technology Officer at Joyent.
Bryan Cantrill (born 1973) is an American Software Engineer
who worked at Sun Microsystems and later at Oracle Corporation following
its acquisition of Sun. Cantrill was included in the TR35 list for his
development of DTrace, a function of the OS Solaris 10 that provides a
non-invasive means for real-time tracing and diagnosis of software. He
is currently Chief Technology Officer at Joyent.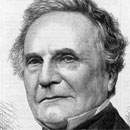 Charles Babbage FRS (26 December 1791 – 18 October 1871) was
an English polymath. He was a mathematician, philosopher, inventor and
mechanical engineer, who is best remembered now for originating the
concept of a programmable computer.
Charles Babbage FRS (26 December 1791 – 18 October 1871) was
an English polymath. He was a mathematician, philosopher, inventor and
mechanical engineer, who is best remembered now for originating the
concept of a programmable computer.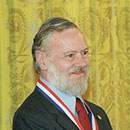 Dennis Ritchie(September 9, 1941 – c. October 12, 2011) was an
American computer scientist. He created the C programming language and,
with long-time colleague Ken Thompson, the Unix operating system.
Ritchie and Thompson received the Turing Award from the ACM in 1983.
Dennis Ritchie(September 9, 1941 – c. October 12, 2011) was an
American computer scientist. He created the C programming language and,
with long-time colleague Ken Thompson, the Unix operating system.
Ritchie and Thompson received the Turing Award from the ACM in 1983.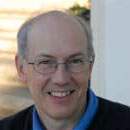 David J. Brown is an American computer scientist. He was one
of a small group that helped to develop the system at Stanford that
later resulted in Sun Microsystems, and later was a founder Silicon
Graphics in 1982. He define the application binary interface for
Solaris, Sun's principal system software product.
David J. Brown is an American computer scientist. He was one
of a small group that helped to develop the system at Stanford that
later resulted in Sun Microsystems, and later was a founder Silicon
Graphics in 1982. He define the application binary interface for
Solaris, Sun's principal system software product. Edgar F. Codd (August 19, 1923 – April 18, 2003) was an
English computer scientist who, while working for IBM, invented the
relational model for database management, the theoretical basis for
relational databases. He made other valuable contributions to computer
science.
Edgar F. Codd (August 19, 1923 – April 18, 2003) was an
English computer scientist who, while working for IBM, invented the
relational model for database management, the theoretical basis for
relational databases. He made other valuable contributions to computer
science. Frances Allen (born August 4, 1932) is an American computer
scientist and pioneer in the field of optimizing compilers. Her
achievements include seminal work in compilers, code optimization, and
parallelization. She also had a role in intelligence work on programming
languages.
Frances Allen (born August 4, 1932) is an American computer
scientist and pioneer in the field of optimizing compilers. Her
achievements include seminal work in compilers, code optimization, and
parallelization. She also had a role in intelligence work on programming
languages. Gordon Bell (born August 19, 1934) is an American electrical
engineer and manager. An early employee of Digital Equipment Corporation
(DEC) 1960–1966, Bell designed several of their PDP machines and later
became Vice President of Engineering 1972-1983, overseeing the
development of the VAX.
Gordon Bell (born August 19, 1934) is an American electrical
engineer and manager. An early employee of Digital Equipment Corporation
(DEC) 1960–1966, Bell designed several of their PDP machines and later
became Vice President of Engineering 1972-1983, overseeing the
development of the VAX. Gregory Chaitin (born 15th. November, 1947 in Argentina) is an
Argentine-American mathematician and computer scientist. Beginning in
the late 1960s, Chaitin made contributions to algorithmic information
theory and metamathematics, in particular an computer-theoretic result
equivalent to Godel's incompleteness theorem.
Gregory Chaitin (born 15th. November, 1947 in Argentina) is an
Argentine-American mathematician and computer scientist. Beginning in
the late 1960s, Chaitin made contributions to algorithmic information
theory and metamathematics, in particular an computer-theoretic result
equivalent to Godel's incompleteness theorem. James Gosling OC (born May 19, 1955) is a Canadian computer
scientist, best known as the father of the Java programming language. In
1977, Gosling received a Bachelor of Science in Computer Science from
the University of Calgary.
James Gosling OC (born May 19, 1955) is a Canadian computer
scientist, best known as the father of the Java programming language. In
1977, Gosling received a Bachelor of Science in Computer Science from
the University of Calgary.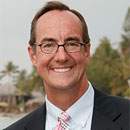 John Backus (December 3, 1924 – March 17, 2007) was an
American computer scientist. He directed the team that invented the
first widely used high-level programming language (FORTRAN) and was the
inventor of the Backus-Naur form (BNF), a widely used notation to define
formal language syntax.
John Backus (December 3, 1924 – March 17, 2007) was an
American computer scientist. He directed the team that invented the
first widely used high-level programming language (FORTRAN) and was the
inventor of the Backus-Naur form (BNF), a widely used notation to define
formal language syntax.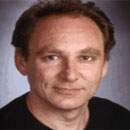 John Crowcroft (born 23 November 1957) is the Marconi
Professor of Communications Systems in the Computer Laboratory of the
University of Cambridge. Professor Jon Crowcroft is distinguished for
his many seminal contributions to the development of the Internet. His
work on satellite link interconnection techniques in the 1980s paved the
way for rural broadband.
John Crowcroft (born 23 November 1957) is the Marconi
Professor of Communications Systems in the Computer Laboratory of the
University of Cambridge. Professor Jon Crowcroft is distinguished for
his many seminal contributions to the development of the Internet. His
work on satellite link interconnection techniques in the 1980s paved the
way for rural broadband. Larry Page (born March 26, 1973) is an American business
magnate and computer scientist who is the co-founder of Google,
alongside Sergey Brin. On April 4, 2011, Page succeeded Eric Schmidt as
the chief executive officer of Google. As of 2014, Page's personal
wealth is estimated to be US$32. 3 billion, ranking him #19 on the
Forbes list of billionaires.
Larry Page (born March 26, 1973) is an American business
magnate and computer scientist who is the co-founder of Google,
alongside Sergey Brin. On April 4, 2011, Page succeeded Eric Schmidt as
the chief executive officer of Google. As of 2014, Page's personal
wealth is estimated to be US$32. 3 billion, ranking him #19 on the
Forbes list of billionaires. Larry Wall (born September 27, 1954) is a computer programmer
and author, most widely known as the creator of the Perl programming
language and Camelia, the spunky spokesbug for Perl 6. Wall grew up in
south Los Angeles and then Bremerton, Washington, before starting higher
education at Seattle Pacific University in 1976.
Larry Wall (born September 27, 1954) is a computer programmer
and author, most widely known as the creator of the Perl programming
language and Camelia, the spunky spokesbug for Perl 6. Wall grew up in
south Los Angeles and then Bremerton, Washington, before starting higher
education at Seattle Pacific University in 1976.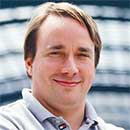 Linus Benedict Torvalds (born December 28, 1969) is a Finnish
American software engineer, and he is well known for the architect and
development of the Linux kernel. He was honored, along with Shinya
Yamanaka, with the 2012 Millennium Technology Prize by the Technology
Academy Finland "in recognition of his creation of a new open source
operating system for computers leading to the widely used Linux kernel.
Linus Benedict Torvalds (born December 28, 1969) is a Finnish
American software engineer, and he is well known for the architect and
development of the Linux kernel. He was honored, along with Shinya
Yamanaka, with the 2012 Millennium Technology Prize by the Technology
Academy Finland "in recognition of his creation of a new open source
operating system for computers leading to the widely used Linux kernel. Luis Von Ahn (born 1979) is a Guatemalan entrepreneur and an
associate professor in the Computer Science Department at Carnegie
Mellon University. He is known as one of the pioneers of crowdsourcing.
He is the founder of the company reCAPTCHA, which was sold to Google in
2009, and the co-founder and CEO of Duolingo, a popular
language-learning platform.
Luis Von Ahn (born 1979) is a Guatemalan entrepreneur and an
associate professor in the Computer Science Department at Carnegie
Mellon University. He is known as one of the pioneers of crowdsourcing.
He is the founder of the company reCAPTCHA, which was sold to Google in
2009, and the co-founder and CEO of Duolingo, a popular
language-learning platform.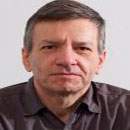 Luca Cardelli FRS is an Italian computer scientist who is an
Assistant Director at Microsoft Research in Cambridge, UK. Cardelli is
well known for his research in type theory and operational semantics.
Among other contributions, he helped design Modula-3, implemented the
first compiler for the (non-pure) functional programming language ML.
Luca Cardelli FRS is an Italian computer scientist who is an
Assistant Director at Microsoft Research in Cambridge, UK. Cardelli is
well known for his research in type theory and operational semantics.
Among other contributions, he helped design Modula-3, implemented the
first compiler for the (non-pure) functional programming language ML. Michael Dell (born February 23, 1965) is an American business
magnate, investor, philanthropist, and author. He is known as the
founder and CEO of Dell Inc., one of the world’s leading sellers of
personal computers (PCs).
Michael Dell (born February 23, 1965) is an American business
magnate, investor, philanthropist, and author. He is known as the
founder and CEO of Dell Inc., one of the world’s leading sellers of
personal computers (PCs). Michael Dertouzos (November 5, 1936 - August 27, 2001) was a
Professor at the Massachusetts Institute of Technology and Director of
the M.I.T. Laboratory for Computer Science (LCS) from 1974 to 2001.
During Dertouzos's term, LCS innovated in a variety of areas, including
RSA encryption, the spreadsheet, the NuBus, the X Window System, and the
Internet.
Michael Dertouzos (November 5, 1936 - August 27, 2001) was a
Professor at the Massachusetts Institute of Technology and Director of
the M.I.T. Laboratory for Computer Science (LCS) from 1974 to 2001.
During Dertouzos's term, LCS innovated in a variety of areas, including
RSA encryption, the spreadsheet, the NuBus, the X Window System, and the
Internet. Maurice Vincent Wilkes (26 June 1913 – 29 November 2010) was a
British computer scientist credited with several important developments
in computing. At the time of his death, Wilkes was an Emeritus
Professor of the University of Cambridge. He received a number of
distinctions.
Maurice Vincent Wilkes (26 June 1913 – 29 November 2010) was a
British computer scientist credited with several important developments
in computing. At the time of his death, Wilkes was an Emeritus
Professor of the University of Cambridge. He received a number of
distinctions. Nello Cristianini (born 1968) is a Professor of Artificial
Intelligence at the University of Bristol, a recipient of the Royal
Society Wolfson Research Merit Award. His research contributions across
different areas, such as machine learning, artificial intelligence and
bioinformatics. Specifically, his work is concentrated in the
statistical analysis of the learning algorithms.
Nello Cristianini (born 1968) is a Professor of Artificial
Intelligence at the University of Bristol, a recipient of the Royal
Society Wolfson Research Merit Award. His research contributions across
different areas, such as machine learning, artificial intelligence and
bioinformatics. Specifically, his work is concentrated in the
statistical analysis of the learning algorithms. Philip Don Estridge (June 23, 1937 - August 2, 1985), known as
Don Estridge, led development of the original IBM Personal Computer
(PC), and thus is known as "father of the IBM PC". His decisions
dramatically changed the computer industry, resulting in a vast increase
in the number of personal computers sold and bought.
Philip Don Estridge (June 23, 1937 - August 2, 1985), known as
Don Estridge, led development of the original IBM Personal Computer
(PC), and thus is known as "father of the IBM PC". His decisions
dramatically changed the computer industry, resulting in a vast increase
in the number of personal computers sold and bought.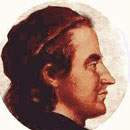 Philipp November 25, 1739 in Scharnhausen, today part of
Ostfildern - May 2, 1790 in Echterdingen, today part of
Leinfelden-Echterdingen) was a German priest and inventor. In about 1763
he devised a precision sundial, or heliochronometer that incorporated
the correction for the equation of time.
Philipp November 25, 1739 in Scharnhausen, today part of
Ostfildern - May 2, 1790 in Echterdingen, today part of
Leinfelden-Echterdingen) was a German priest and inventor. In about 1763
he devised a precision sundial, or heliochronometer that incorporated
the correction for the equation of time.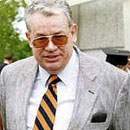 Per Brinch Hansen (November 13, 1938 – July 31, 2007) was a
Danish-American computer scientist known for concurrent programming
theory. In 1970, his research in computer science focused on concurrent
programming, Inspired by Ole-Johan Dahl and Kristen Nygaard's
programming language Simula 67, he invented the monitor concept in 1972.
Per Brinch Hansen (November 13, 1938 – July 31, 2007) was a
Danish-American computer scientist known for concurrent programming
theory. In 1970, his research in computer science focused on concurrent
programming, Inspired by Ole-Johan Dahl and Kristen Nygaard's
programming language Simula 67, he invented the monitor concept in 1972.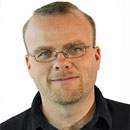 Rasmus Lerdorf (born 22 November 1968) is a Greenlandic
programmer with Canadian citizenship. He created the PHP scripting
language, authoring the first two versions of the language and
participating in the development of later versions led by a group of
developers including Jim Winstead.
Rasmus Lerdorf (born 22 November 1968) is a Greenlandic
programmer with Canadian citizenship. He created the PHP scripting
language, authoring the first two versions of the language and
participating in the development of later versions led by a group of
developers including Jim Winstead. Richard Stallman (born March 16, 1953) is an American is a
software freedom activist and computer programmer. He is best known for
launching the GNU Project, founding the Free Software Foundation,
developing the GNU Compiler Collection and GNU Emacs, and writing the
GNU General Public License.
Richard Stallman (born March 16, 1953) is an American is a
software freedom activist and computer programmer. He is best known for
launching the GNU Project, founding the Free Software Foundation,
developing the GNU Compiler Collection and GNU Emacs, and writing the
GNU General Public License.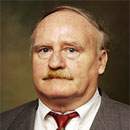 Robert S.Boyer is a retired professor of computer science,
mathematics, and philosophy at The University of Texas at Austin. He and
J Strother Moore invented the Boyer–Moore string search algorithm, a
particularly efficient string searching algorithm, in 1977. He and Moore
also collaborated on the Boyer–Moore automated theorem prover, Nqthm,
in 1992.
Robert S.Boyer is a retired professor of computer science,
mathematics, and philosophy at The University of Texas at Austin. He and
J Strother Moore invented the Boyer–Moore string search algorithm, a
particularly efficient string searching algorithm, in 1977. He and Moore
also collaborated on the Boyer–Moore automated theorem prover, Nqthm,
in 1992. Robert "Bob" Kahn (born December 23, 1938) is an Amercian
engineer who is well-regarded as one of "the fathers the Internet"
sharing this title with American Internet pioneer Vint Cerf. In December
1997, Kahn and Cerf received the U.S. National Medal of Technology, for
founding and developing the Internet. Kahn is the co-inventor of the
TCP/IP protocols, the most important communication protocol of the
Internet. He was responsible for originating DARPA’s Internet program.
Robert "Bob" Kahn (born December 23, 1938) is an Amercian
engineer who is well-regarded as one of "the fathers the Internet"
sharing this title with American Internet pioneer Vint Cerf. In December
1997, Kahn and Cerf received the U.S. National Medal of Technology, for
founding and developing the Internet. Kahn is the co-inventor of the
TCP/IP protocols, the most important communication protocol of the
Internet. He was responsible for originating DARPA’s Internet program. Sabeer Bhatia was born in Chandigarh on 30 December 1968. He
grew up in Bangalore and had his early education at the Bishop's School
in Pune and then at St Joseph's Boys High School in Bangalore. Sabeer
Bhatia is an Indian American entrepreneur who founded the Hotmail email
service and Jaxt.
Sabeer Bhatia was born in Chandigarh on 30 December 1968. He
grew up in Bangalore and had his early education at the Bishop's School
in Pune and then at St Joseph's Boys High School in Bangalore. Sabeer
Bhatia is an Indian American entrepreneur who founded the Hotmail email
service and Jaxt. Sergey Brin (born August 21, 1973) is an American computer
scientist and internet entrepreneur who, with Larry Page, co-founded
Google, one of the most profitable Internet companies. As of June 2014,
his personal wealth was estimated to be US$ 30 billion. Together, Brin
and Page own about 16 percent of the company.
Sergey Brin (born August 21, 1973) is an American computer
scientist and internet entrepreneur who, with Larry Page, co-founded
Google, one of the most profitable Internet companies. As of June 2014,
his personal wealth was estimated to be US$ 30 billion. Together, Brin
and Page own about 16 percent of the company. Serge Abiteboul is a computer scientist working in the areas
of data management, database theory, and finite model theory. He is
currently a senior researcher at the Institute national de recherche en
informatique et en automatique (INRIA), the French national research
institute focussing on computer science and related areas, and has been a
professor of the College de France.
Serge Abiteboul is a computer scientist working in the areas
of data management, database theory, and finite model theory. He is
currently a senior researcher at the Institute national de recherche en
informatique et en automatique (INRIA), the French national research
institute focussing on computer science and related areas, and has been a
professor of the College de France. Better known as the co-founder of Apple Computers, Steve Jobs was an
American inventor who pioneered the microcomputer revolution in the
1970s and 1980s. Born in San Francisco, California, Jobs laid the
foundation of Apple Computers in 1976, along with his partner Steve
Wozniak.
Better known as the co-founder of Apple Computers, Steve Jobs was an
American inventor who pioneered the microcomputer revolution in the
1970s and 1980s. Born in San Francisco, California, Jobs laid the
foundation of Apple Computers in 1976, along with his partner Steve
Wozniak. Tim Berners Lee (born 8 June 1955), also known as "TimBL", is a
British computer scientist, best known as the inventor of the World
Wide Web. Berners Lee is the director of the World Wide Web Consortium
(W3C), which oversees the Web's continued development.
Tim Berners Lee (born 8 June 1955), also known as "TimBL", is a
British computer scientist, best known as the inventor of the World
Wide Web. Berners Lee is the director of the World Wide Web Consortium
(W3C), which oversees the Web's continued development. Vint Cerf ( born June 23, 1943) is an American internet
pioneer, who is recognized as one of "the fathers of the Internet",
sharing this title with American engineer Bob Kahn. His contributions
have been acknowledged and lauded, repeatedly. He was instrumental in
the development of the first commercial email system (MCI Mail)
connected to the Internet.
Vint Cerf ( born June 23, 1943) is an American internet
pioneer, who is recognized as one of "the fathers of the Internet",
sharing this title with American engineer Bob Kahn. His contributions
have been acknowledged and lauded, repeatedly. He was instrumental in
the development of the first commercial email system (MCI Mail)
connected to the Internet.